Introduction
Scientific reasoning is an essential component of the TEAS exam. It evaluates knowledge in chemistry, biology, physiology, and anatomy. The skills entail evaluating evidence, understanding cause-and-effect relationships, and understanding relevant hypotheses.
The TEAS test typically assesses students’ readiness to enter nursing programs and has strong ties between their performance on the test and future academic success. TEAS test is a crucial exam for your nursing career, so you need to prepare well and polish your scientific reasoning skills with the help of this article.
How To Develop Scientific Reasoning for the TEAS
1. Enhance logical reasoning
Logical thinking is essential in scientific reasoning since it allows students and researchers to analyze their data, test the hypotheses they have generated, and draw conclusions from their research. Your logical thinking skills should be top-notch for enhanced scientific reasoning TEAS.
Enhancing your logical reasoning skills entails engaging in activities that challenge your understanding. These could include designing experiments, creating hypotheses, and interpreting research results. You can practice daily reasoning exercises, seek source feedback, and apply logical skills to enhance your logical abilities in real-world situations.
2. Strengthen Your Critical Thinking Skills
Critical thinking enables you to work through your study perfectly, from creating hypotheses to coming up with valid conclusions. It helps students actively evaluate information, separate logic in arguments, identify bias, and analyze the evidence effectively. There are several strategies to help boost your critical thinking skills, including:
- A robust foundation in the scientific domain’s principles, core concepts, and methods.
- Actively participating in problem-solving exercises, creating experiments, and interpreting results.
- Seeking feedback from peers and experts and self-reflection can also help boost your critical thinking skills since you will know and work on your weaknesses.
- Mind-boggling activities such as brainteasers, games, and puzzles enhance your critical thinking skills.
3. Use Practice Questions
Scientific reasoning TEAS practice questions can help boost your logical thinking skills. These questions require you to think critically before concluding your answer, enhancing your logical thinking. An example question would be:
You are given two clay balls of equal shape and size, but one is flattened into a pancake shape. Which statement is correct regarding their weight?
- The pancake-shaped piece is heavier than the ball
- The two still weigh the same
- The ball is heavier than the pancake-shaped piece
An example of a real-life scenario logical thinking question would be:
A candle is lit under a glass, and the flame quickly goes out, causing water to rush into the glass. What explanation could account for this phenomenon?
Answer: The flame converted oxygen into carbon dioxide, which dissolved into water. This lowered the air pressure in the glass, giving more room for water to enter.
Such scenarios and practice questions will test and apply scientific reasoning skills, helping you enhance your ability to analyze situations and solve problems.
Essential Scientific Reasoning Skills on the TEAS Test
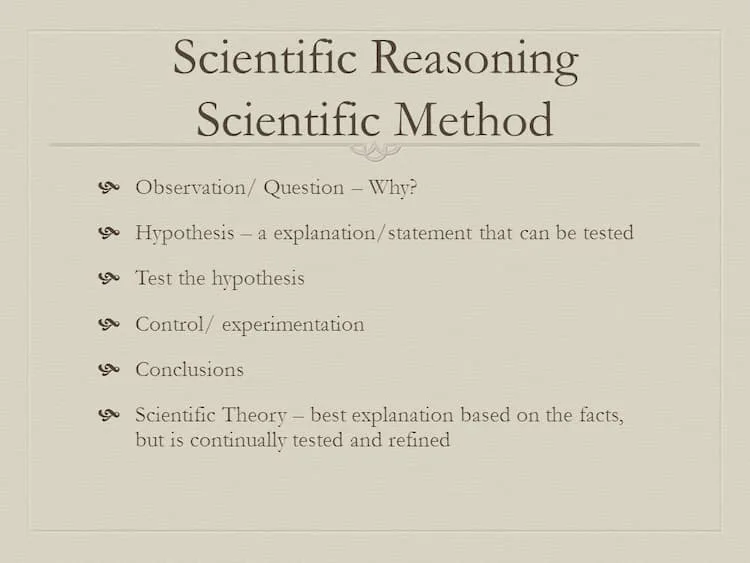
1. The Scientific Method
This systematic process investigates and solves problems in different fields, such as science. The process entails a series of crucial steps researchers must follow to identify, analyze, and draw conclusions about the surroundings. These steps include:
Step 1: Question – You start by identifying the problem. Determine what you must investigate and keep that in mind as you handle the issue.
Step 2: Research – The second step entails gathering background information about the question you are to investigate. Review all existing data, knowledge, and research about your topic of study.
Step 3: Hypothesis—The third step is proposing a hypothesis based on the data you collected about the question. A hypothesis answers the question and is tested to prove its truth via experimentation.
Step 4: Experiment—Create an experiment to test the hypothesis. Set the right conditions for this experiment, collect sufficient data, and ensure it is replicable.
Step 5: Observation—This entails collecting and recording data during the experiment. Researchers measure and record the variables, including the dependent and independent variables.
Step 6: Analysis—Step 6 involves analyzing the data collected during the experiment to conclude. The researcher evaluates the data to determine whether it rejects or supports the hypothesis.
Step 7: Report – Finally, you have to pen down your findings of the experiment, which could often lead to further experimentation or new questions. You must present the experiment results concisely and highlight all potential applications and implications.
2. Principles of Experimental Design
Experimental design is a discipline of applied statistics concerned with the design, execution, analysis, and interpretation of controlled tests. It is used to determine the factors that influence the value of a parameter or set of parameters. It is a robust data-gathering and analysis tool that may be used in various experiments. Experimental design entails designing an experiment to achieve specific goals. Planning an experiment correctly is critical to ensuring that the appropriate type of data and sample size are available to answer the research questions of interest as clearly and efficiently as feasible.
-
Hypothesis formation
A testable hypothesis is not a straightforward claim. It is a pretty complex statement that must provide a clear introduction to a scientific investigation, its goals, and potential outcomes. However, there are other factors to consider while developing a persuasive hypothesis.
1. State the problem you are attempting to solve
Ensure that the hypothesis accurately identifies the topic and emphasis of the investigation.
2. Try writing your theory as an if-then statement
Follow this template: A particular result is predicted if a given action is taken.
3. Define the variables
Independent variables are manipulated, controlled, or altered variables. The independent variables are separated from the other research variables. Dependent variables, as the name implies, depend on other study elements. They are affected by a change in the independent variable.
4. Evaluate the hypothesis
To improve your understanding, rigorously evaluate assumptions, predictions, and evidence.
-
Use Data collection methods.
Researchers can use two primary methods to collect data: primary or secondary data collection techniques. Primary data collection involves acquiring original data from the source or directly engaging respondents. This strategy enables researchers to receive firsthand knowledge suited to their research aims. Several methods for gathering primary data include surveys and questionnaires, interviews, observations, focus groups, and experiments.
Secondary data collection uses previously obtained data other than its original objective. Researchers examine and interpret this data to get helpful information. Secondary data can come from various sources, including online databases, published sources, publicly available data, and government and institutional records. Past research studies also act as reliable secondary data collection methods.
-
Data analysis
Data analysis examines, cleans, transforms, and models data to extract insights and aid decision-making. As a data analyst, you will break down large datasets, uncover hidden patterns, and translate numbers into helpful knowledge.
How to analyze data effectively
To analyze data effectively, consider the following crucial hacks:
- Define your goals and questions – before looking at the data; you must determine what you wish to learn and achieve from the exercise.
- Choose your data collection methods—depending on the question or what you aim to achieve, you can use different types of data collection, such as primary, secondary, quantitative, or qualitative.
- Organize and visualize your data—You must organize the data collected to make it easy for anyone to interpret and understand. You can filter, sort, or group the data to make sense to an end user.
- Analyze and interpret your data – use inferential statistics, thematic analysis, or descriptive statistics to analyze and give meaning to your research questions.
- Communicate and apply your findings – the last step is to apply your conclusions using different formats, such as publications, presentations, or reports. Use clear, simple language and citations to convey your points, recommendations, and arguments.
- Learn and enhance your skills – concluding your research should be a continuous improvement and learning process. Continually refine your questions and goals to update your findings based on new insights.
3. Use Data Interpretation Techniques
Data can be interpreted via various techniques, such as tables, charts, and graphs. Enhance your scientific reasoning TEAS skills by learning how to interpret data from any of these techniques:
A. How To Interpret Graphs
The main aim of a graph is to pass information. Below are some simple hacks to help you interpret a graph:
- Determine the type of graph. Graphs are classified into several categories, each delivering a unique information set. Some graphs concentrate on a single variable, while others focus on two or more variables and their relationships.
- Read the legend or title. The title always appears at the top of a graph. It explains what the graph symbolizes, and the legend may offer a key for interpreting any symbols on the graph.
- Examine other texts – Before looking at the graph, read any additional text corresponding to each line or column of data. This action informs you of additional vital facts when evaluating the data given in the graph.
- Observe the y-axis and x-axis – The x-axis is the horizontal axis that represents an independent variable, such as time. It is usually numerical and may include times or dates. The y-axis on the left-hand side of the graph indicates the dependent variable, such as temperature or sales numbers, that changes according to the independent variable.
- Determine what the numbers on the graph mean – Each point on a graph represents a pair of linked values. Each item in a data collection contains two values: x and y. For example, if you are looking at a temperature graph over time, the x-value of each point could indicate a day in January, while the y-value could reflect the highest temperature that day.
- Identify patterns – Understand each data point about both axes, noting any correlations and outliers. For example, if a vehicle’s average mileage per gallon increases as its speed exceeds 30 mph, you may anticipate its fuel consumption per mile to decrease. However, if this does not occur when the vehicle’s speed exceeds 30 mph, it may impact your total average score. That data shows fuel consumption at different speeds.
- Find your data in the graph – Locate the graph’s attributes that provide what you want. For example, if you are looking at a bar graph comparing sales of various products in your area, you might want to know which products sell the most. Find the chart’s longest bars. Then, examine the x-axis at the bottom of the graph to determine which products these bars represent.
B. How To Understand Tables
Extracting information from tables entails several aspects, such as:
- Visual inspection – scanning the table to identify any trends, patterns, or outliers
- Row and column analysis – breaking down the table into rows and columns to systematically analyze the data
- Calculations – performing calculations in the table to have additional insights into the information
- Cross-referencing – cross-referencing the information on the table with external sources to validate findings or gain more information
- Data aggregation – entails summarizing data by aggregating values across columns or rows to simplify complex information.
C. How To Analyse Charts
You can encounter different types of charts and different ways of analyzing each chart.
- Pie charts – here, you need to analyze the size of each slice of the pie relative to the entire pie, compare the categories, and identify visible trends
- Bar charts – analyze the height of each bar to compare values and also interpret any differences by paying attention to the gaps between bars
- Line charts show trends over time, so you start by analyzing the slope and direction of the lines to find patterns. Compare multiple line trajectories and assess their relationships.
Resources for TEAS Scientific Reasoning Preparation
You can use various resources to enhance your scientific reasoning skills as you prepare for the TEAS test. These include recommended websites and books that offer educational content and practice questions. Ensure you use resources from reputable sites, as these are more up-to-date and have a lot of helpful and relevant information.
Recommended books and websites
Books
- Exploring the relationship between scientific reasoning skills and mathematics problem solving – Nor’ain Mohd Tajudin and Mohan Chinnappan
- The Sourcebook for Teaching Science – Norman Herr and James Cunningham
- Thinking, fast and slow – Daniel Kahneman
Websites
- org
- Edulastic
- Khan Academy
- Gizmos
- Knowt
- Brilliant
- Edia
How To Apply Scientific Reasoning in the Real World
Scientific reasoning skills are crucial in the healthcare sector. They enable medical professionals to formulate diagnoses, analyze patient data, and create effective treatment plans. For example, when a patient shows up with specific symptoms, healthcare practitioners will have various hypotheses, perform tests or experiments, and draw conclusions based on the evidence from the tests.
Data analysis and hypothesis testing are crucial in helping practitioners make decisions based on scientific principles and not guesswork or anecdotal information.
Conclusion
Scientific reasoning skills are essential in the healthcare industry as they help practitioners discover and understand what could be ailing patients. That is, hypotheses are created from the patient’s symptoms and tested through experiments and tests in the lab to reject or accept the hypotheses. They will then conclude what is wrong with the patient and administer the proper medication.
Scientific reasoning is quite broad, and with every passing day, you will face a brand-new situation requiring your logical thinking. That is why you must keep honing your skills and exploring more ways to enhance your logical thinking skills.